Target Debugging and Launching
CMake Tools removes some of the friction required in setting up debugging.
Because C and C++ projects may define multiple (sometimes dozens or even
hundreds) of executables, creating a launch.json may be difficult, tedious,
and error-prone.
If you define any executable targets via CMake, CMake Tools will be aware of them and allow you to start a debugger on them.
Note
Debugging is only supported when using CMake Server mode. This mode will be enabled automatically on CMake versions at least as new as 3.7.2, but is completely unavailable on older CMake versions.
Target debugging used to be supported on prior versions, but was difficult and error-prone, creating more problems than it solved. If you are running an older CMake version and wish to use target debugging, you’ll have to update your CMake version.
By default, the launch or debug of an executable target will cause it to be built.
Note
The build on launch can be disabled with a setting, see cmake.buildBeforeRun.
Selecting a Launch Target
The “launch target” or “debug target” is initially unset. The first time you try to run target debugging, CMake Tools will ask you to specify a target, which will be persisted between sessions.
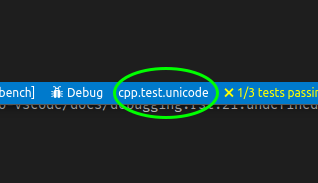
The active launch target is shown in the status bar to the right of the Debug button:

Pressing this button will show the launch target selector and lets one change the active launch target.
Quick Debugging
Quick-debugging lets you start a debugger on a target without ever creating
a launch.json.
Note
At the moment, only the debugger from Microsoft’s vscode-cpptools
extension is supported with quick-debugging. See Debugging with CMake Tools and launch.json
below for using launch.json and other debuggers.
Quick debugging can be started using the CMake: Debug Target command from the command pallette, or by pressing the associated hotkey (the default is Ctrl+F5).
Note
Quick-debugging does not let you specify program arguments or other debugging options. See Debugging with CMake Tools and launch.json for more options.
Debugging with CMake Tools and launch.json
Sometimes, more flexibility is needed for debugging, including setting things
like the working directory or command line arguments. In addition, one may want
to use a debugger other than the one included with Microsoft’s
vscode-cpptools.
All these things can be done using launch.json. The primary obstacle to
using launch.json is that the path to the executable binary might be
difficult to know in advance. CMake Tools can help by using
Command substitution in launch.json. This is already used by things like
the process selection when attaching to a running process. It works by simply
specifying a a command-based substitution in the appropriate field of
launch.json.
Here is a minimal example of a launch.json that uses the
cmake.launchTargetPath and cmake.launchTargetDirectory to start a debugger
on the active selected launch target:
{
    "version": "0.2.0",
    "configurations": [
        {
            "name": "(gdb) Launch",
            "type": "cppdbg",
            "request": "launch",
            // Resolved by CMake Tools:
            "program": "${command:cmake.launchTargetPath}",
            "args": [],
            "stopAtEntry": false,
            "cwd": "${workspaceFolder}",
            "environment": [
                {
                    // add the directory where our target was built to the PATHs
                    // it gets resolved by CMake Tools:
                    "name": "PATH",
                    "value": "$PATH:${command:cmake.launchTargetDirectory}"
                },
                {
                    "name": "OTHER_VALUE",
                    "value": "Something something"
                }
            ],
            "externalConsole": true,
            "MIMode": "gdb",
            "setupCommands": [
                {
                    "description": "Enable pretty-printing for gdb",
                    "text": "-enable-pretty-printing",
                    "ignoreFailures": true
                }
            ]
        }
    ]
}
The value of the program attribute is resolved by CMake Tools to the
absolute path to the program to run.
Note
A successful configure must be executed before
cmake.launchTargetPath and cmake.launchTargetDirectory will resolve correctly.
Running Targets Without a Debugger
Sometimes one will want to just run a target and see its output. This can be done with the CMake: Execute the current target without a debugger command, or the associated keybinding (the default is Shift+F5).
The output of the target will be shown in an integrated terminal.